

Simplify Student Loans
High-level Summary
I validated the concept for an app with a target user group. After that, I led the research team and contributed to the design of the web app, Dough. Dough is a product that helps students reduce their student debt while in school.
My Role
Lead UX Researcher
Designer
The Challenge
The process of taking out student loans and paying them back is difficult even if students do everything right. Many students overborrow and don’t realize that they can return some, or all, of their loans. How can we advise students to make informed financial choices?
Design Beginnings
Our CEO had done secondary research, showed us and we started brainstorming ideas to help student understand and reduce their loans.
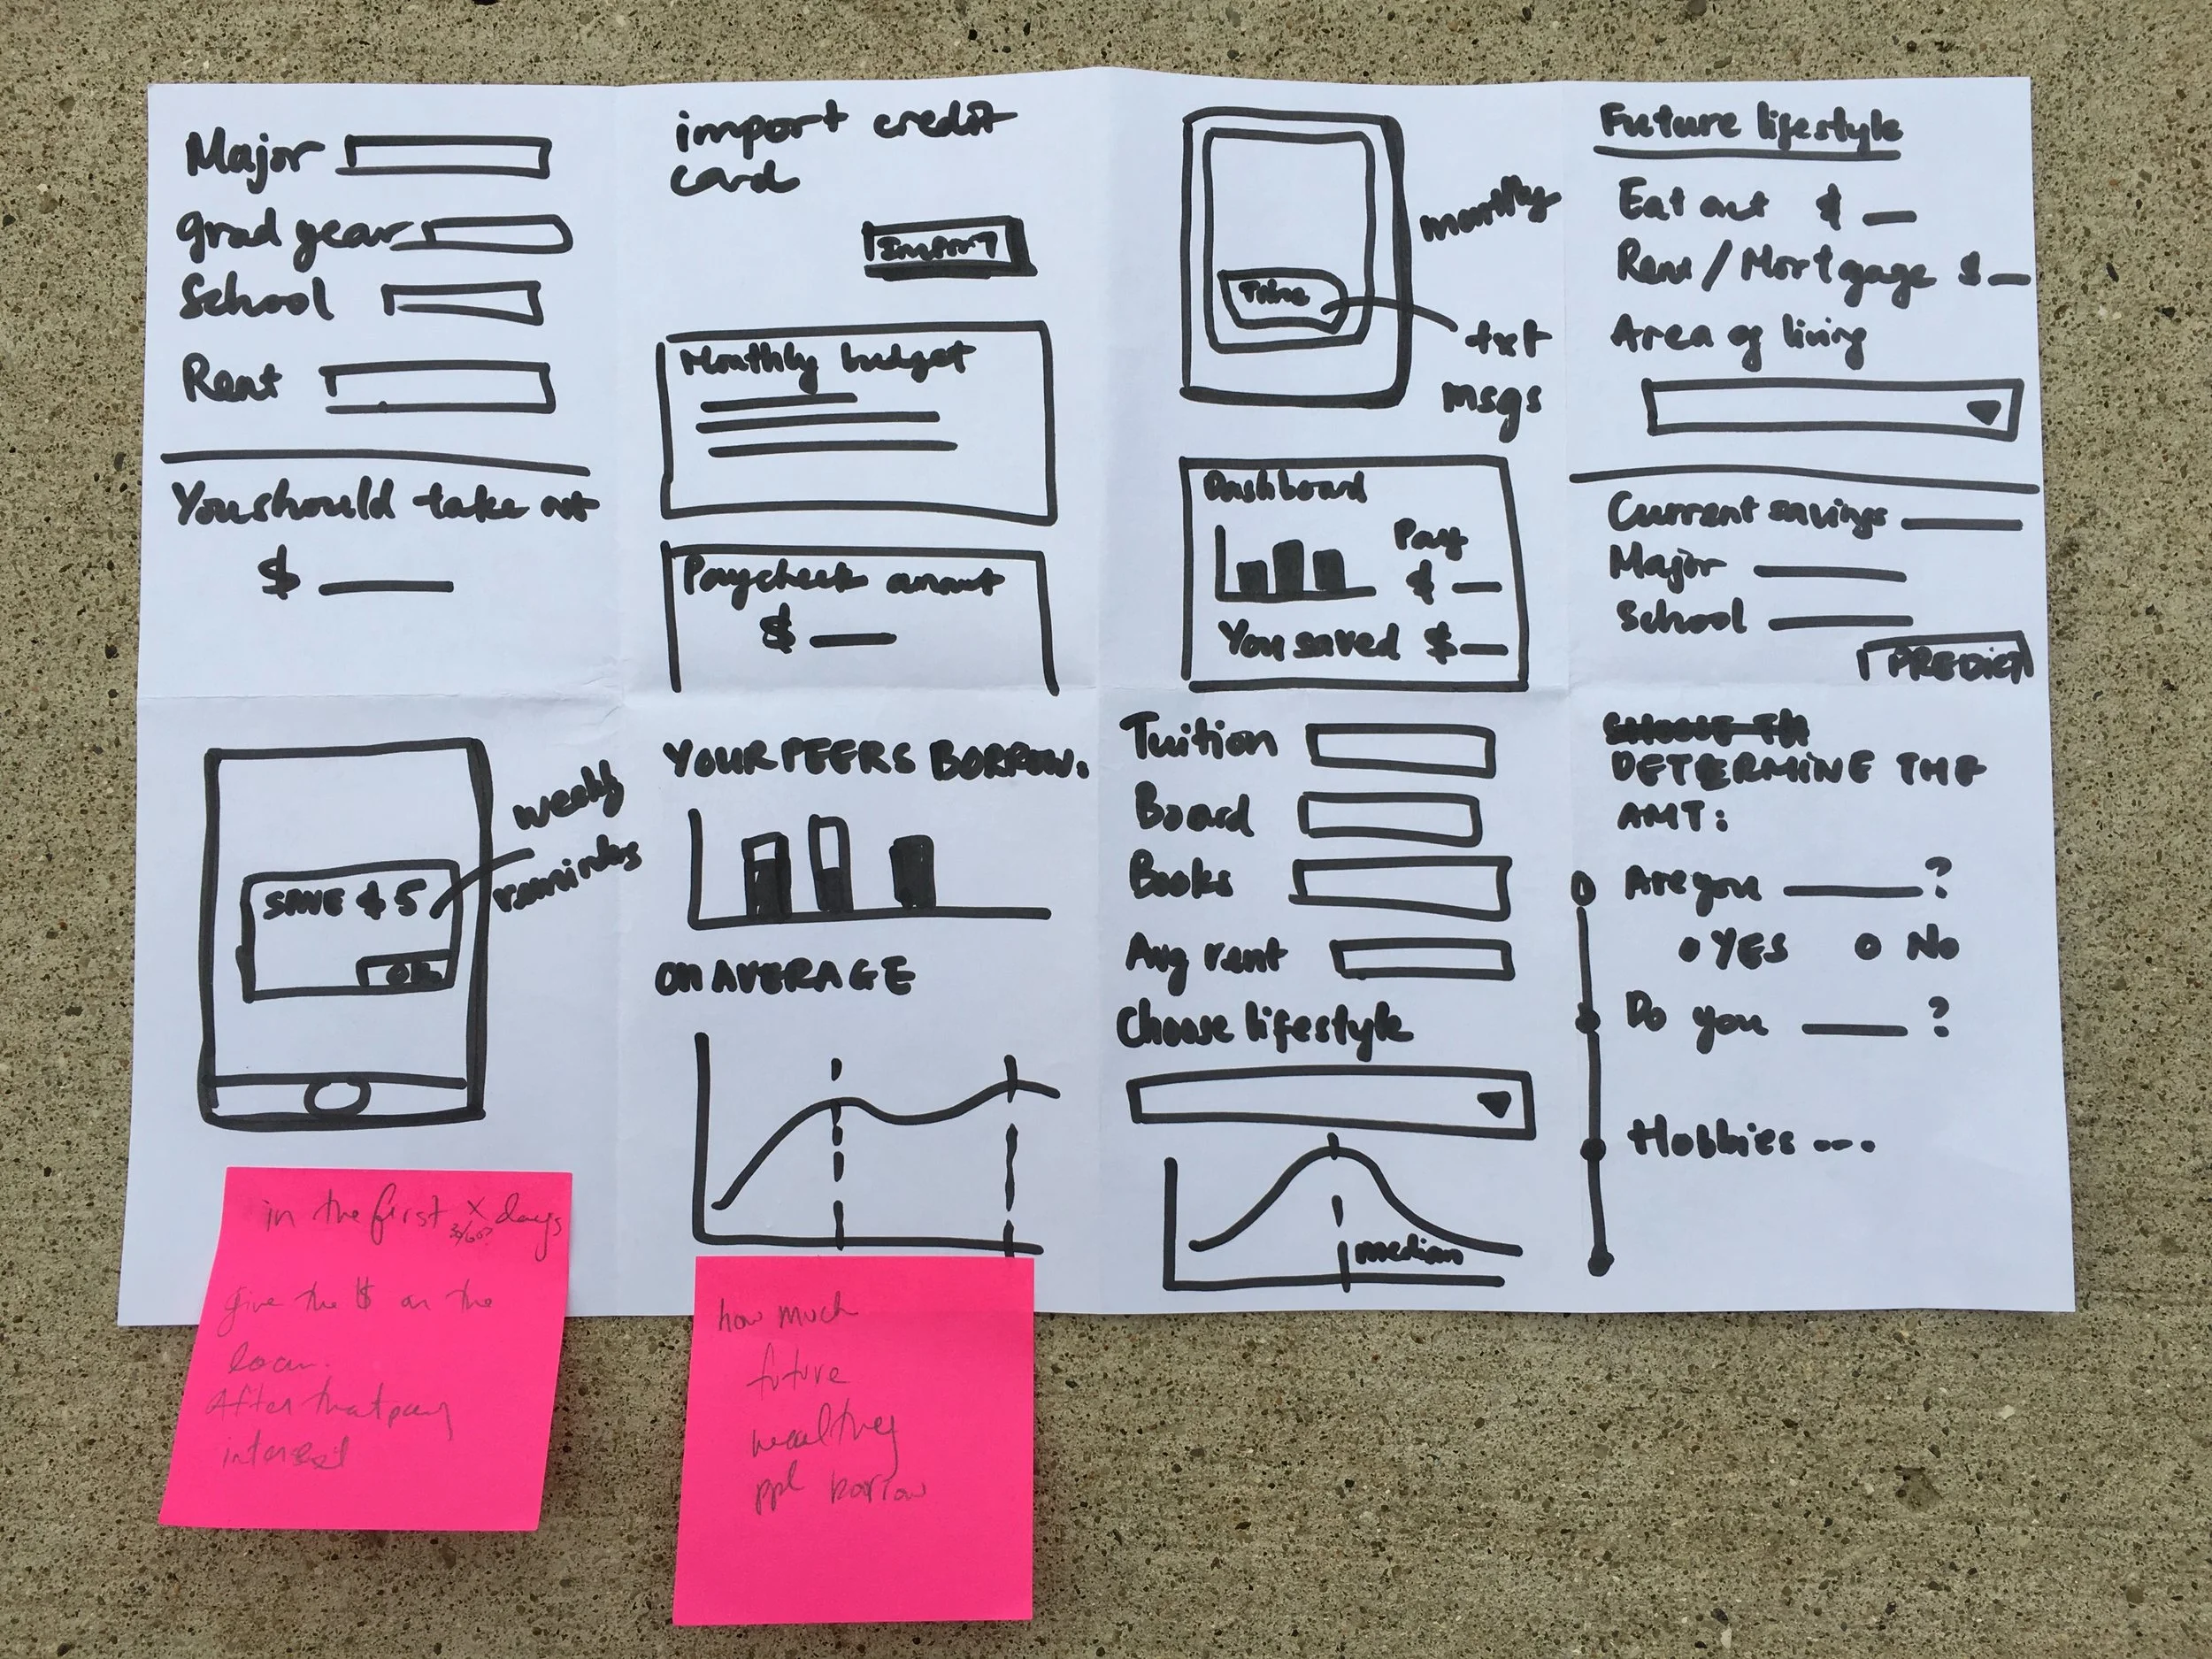
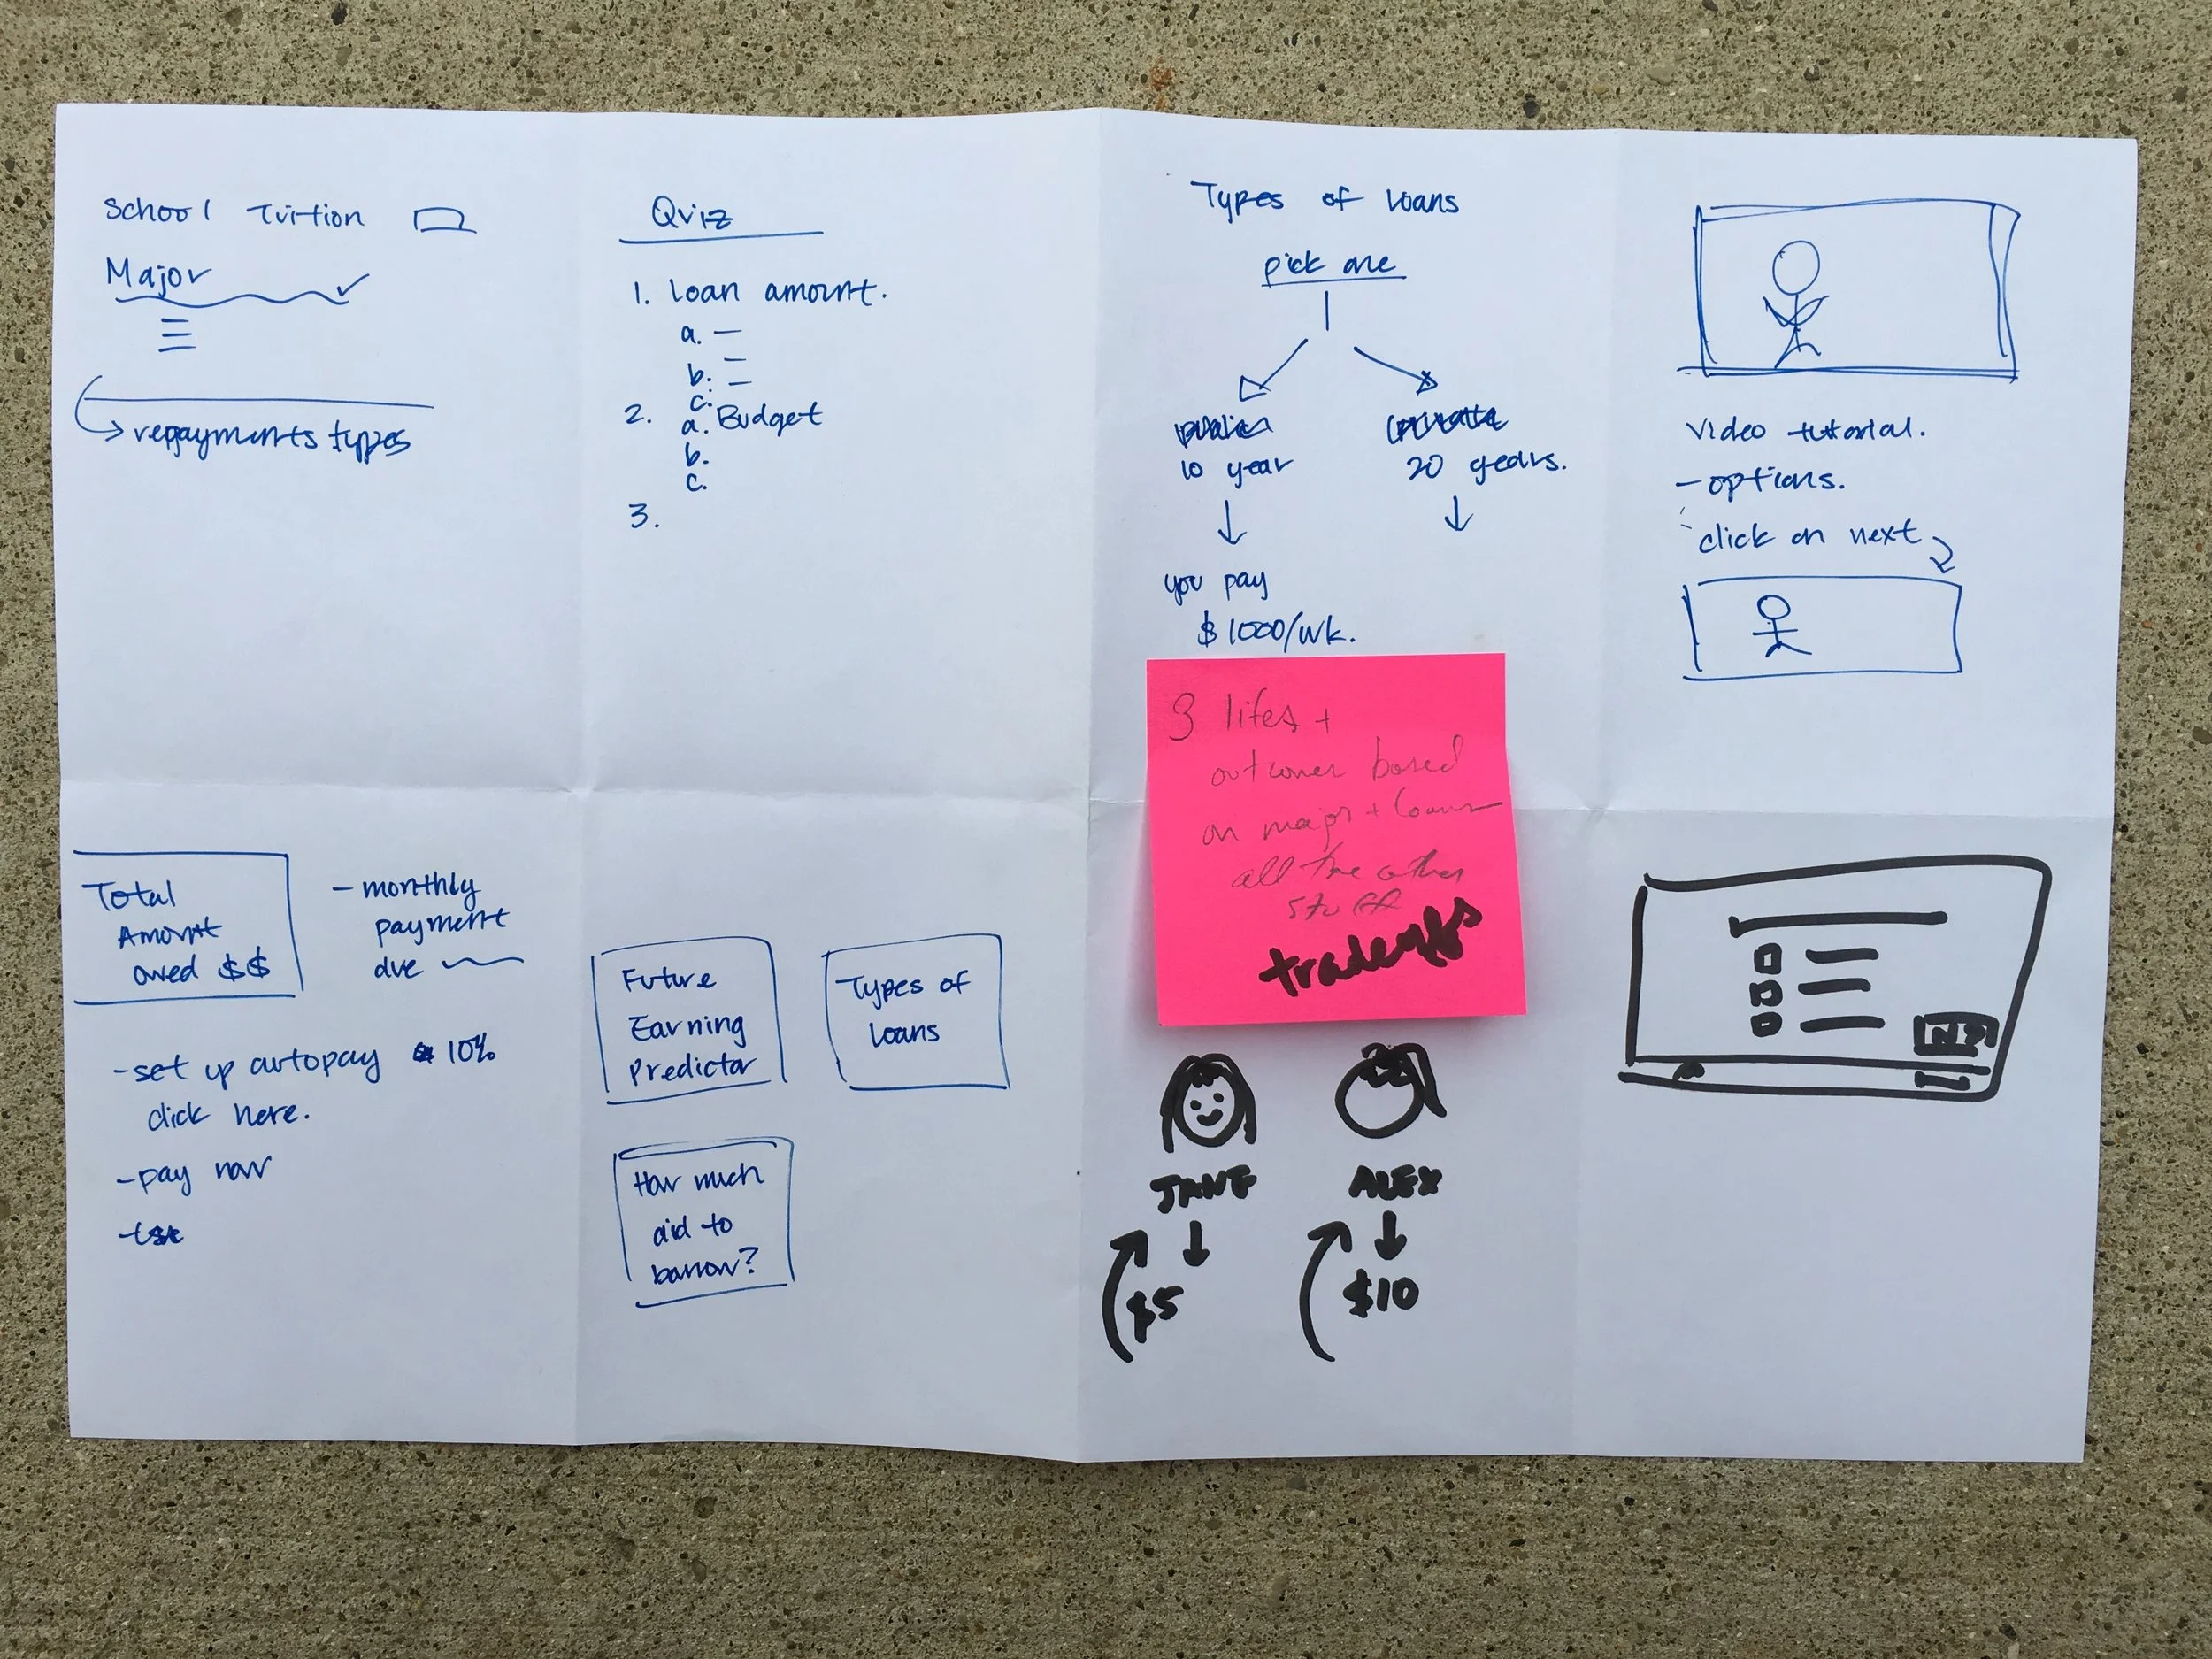
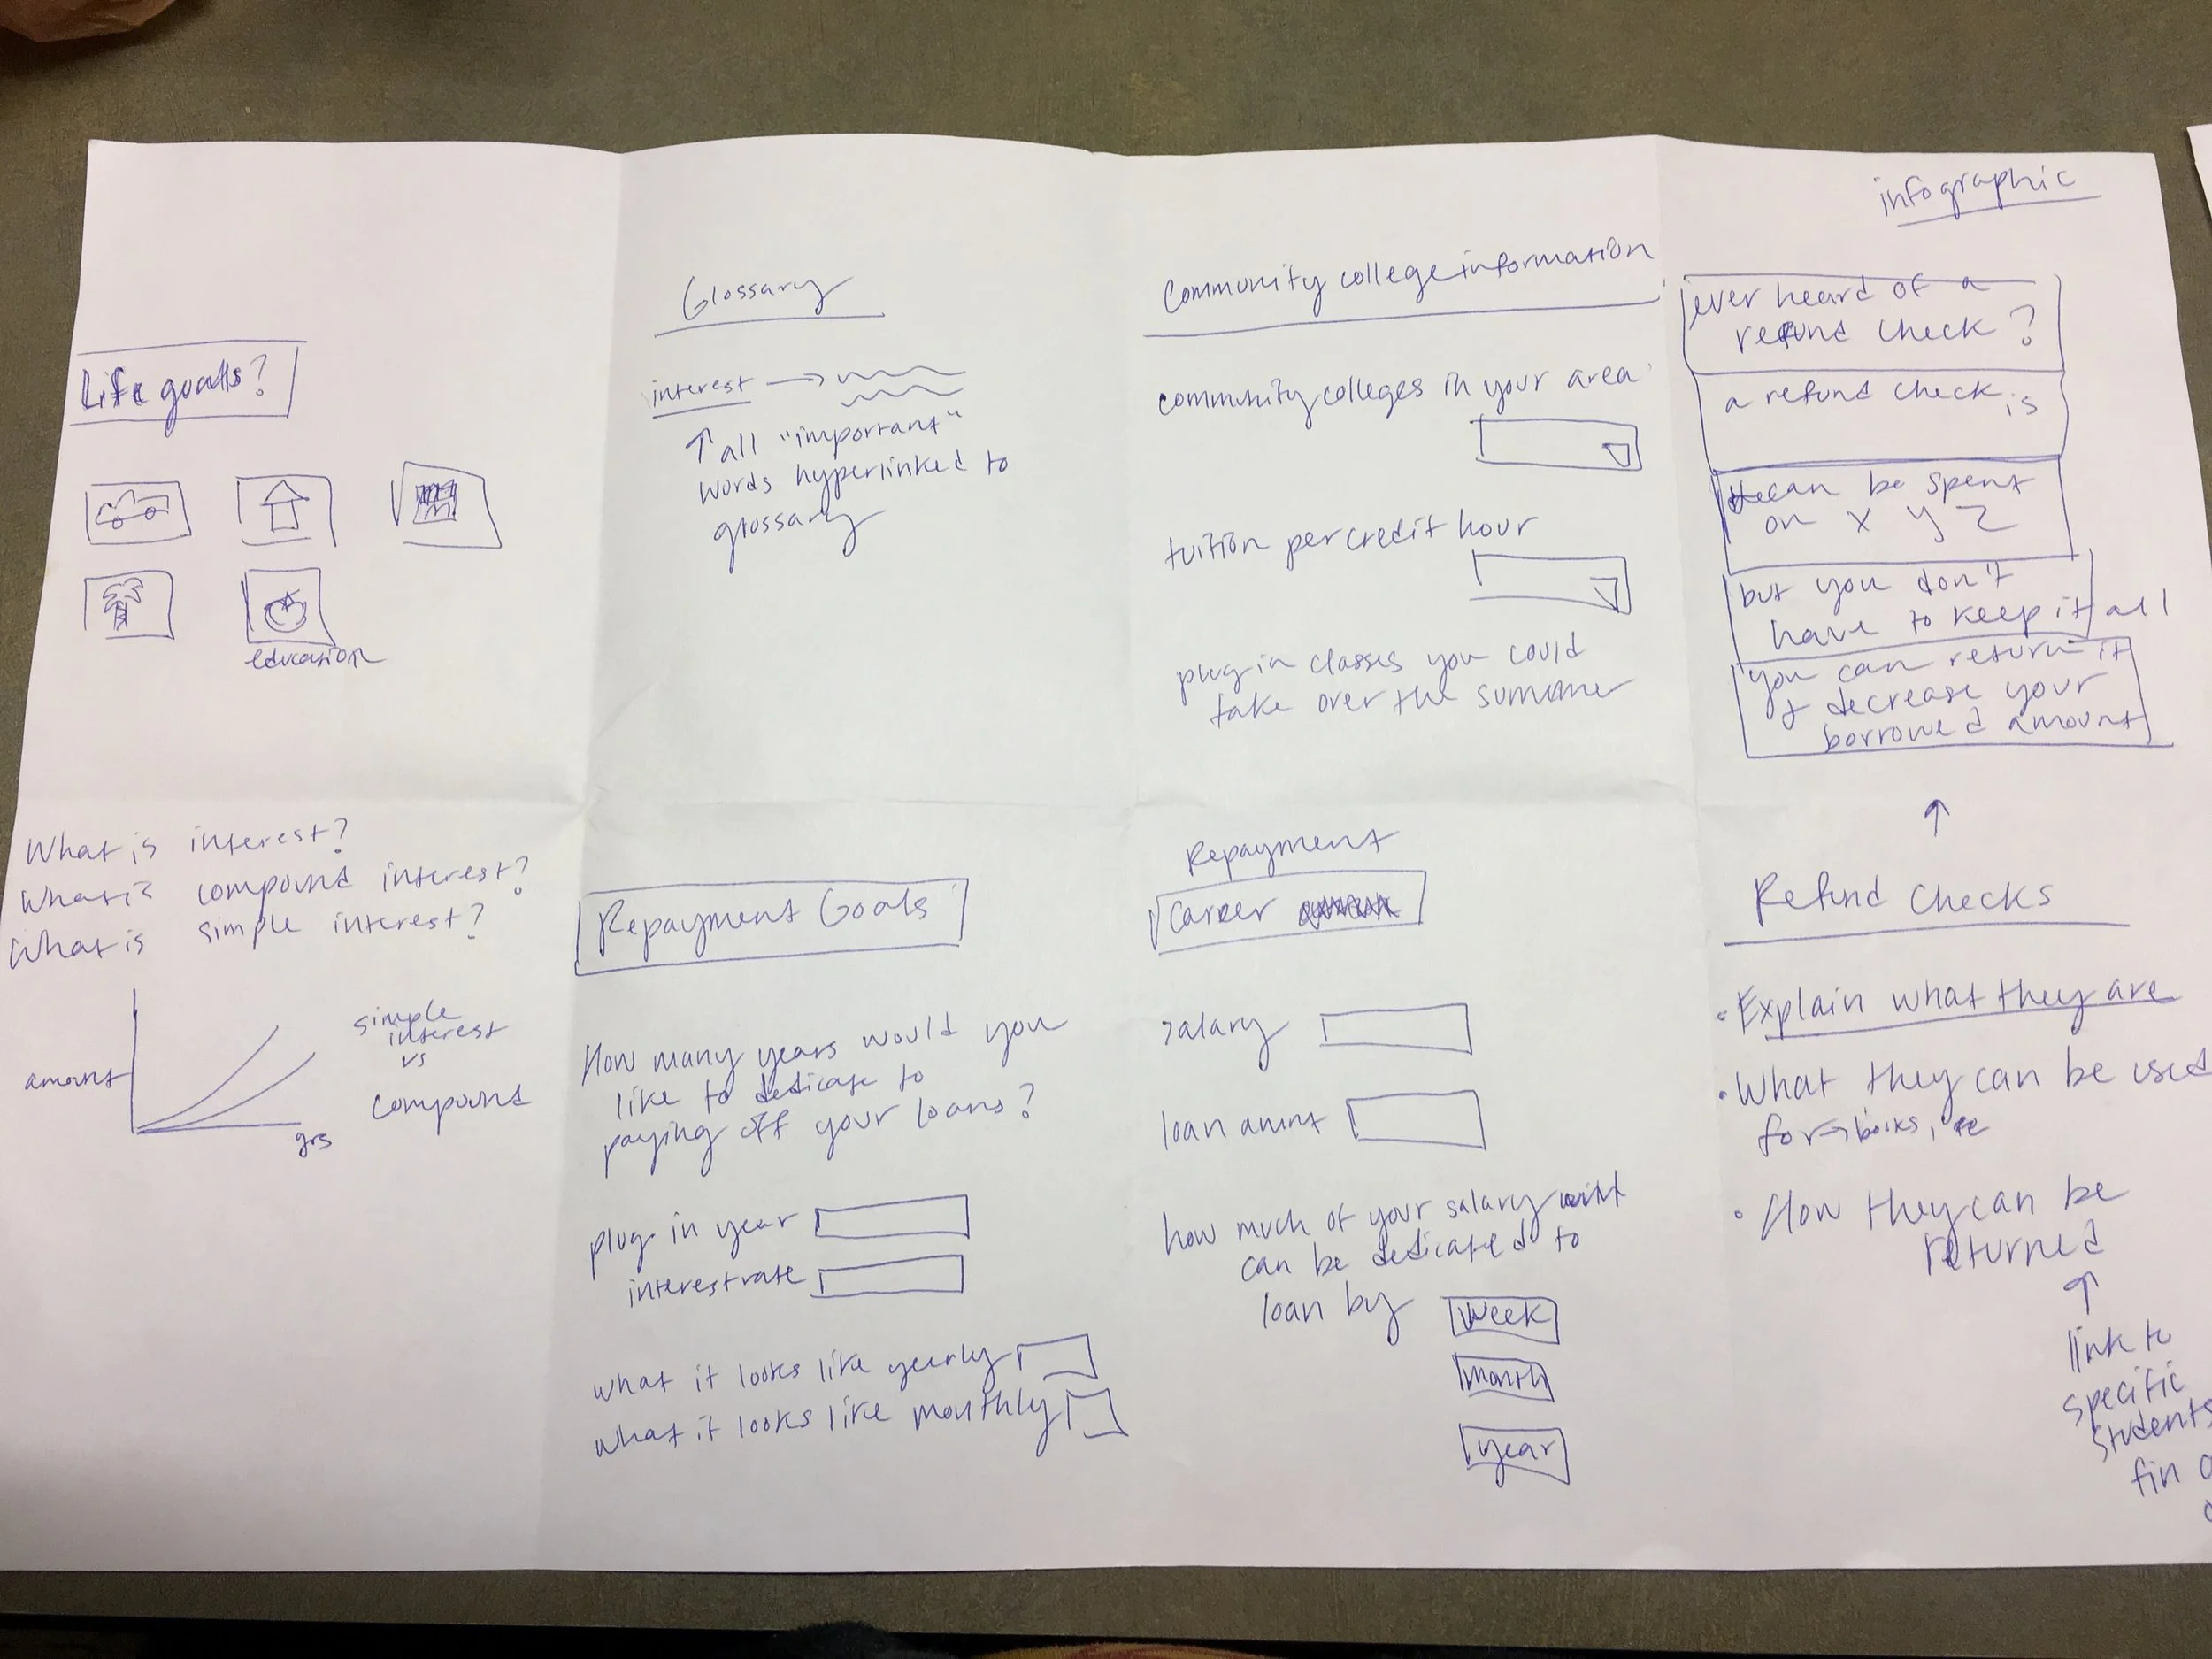
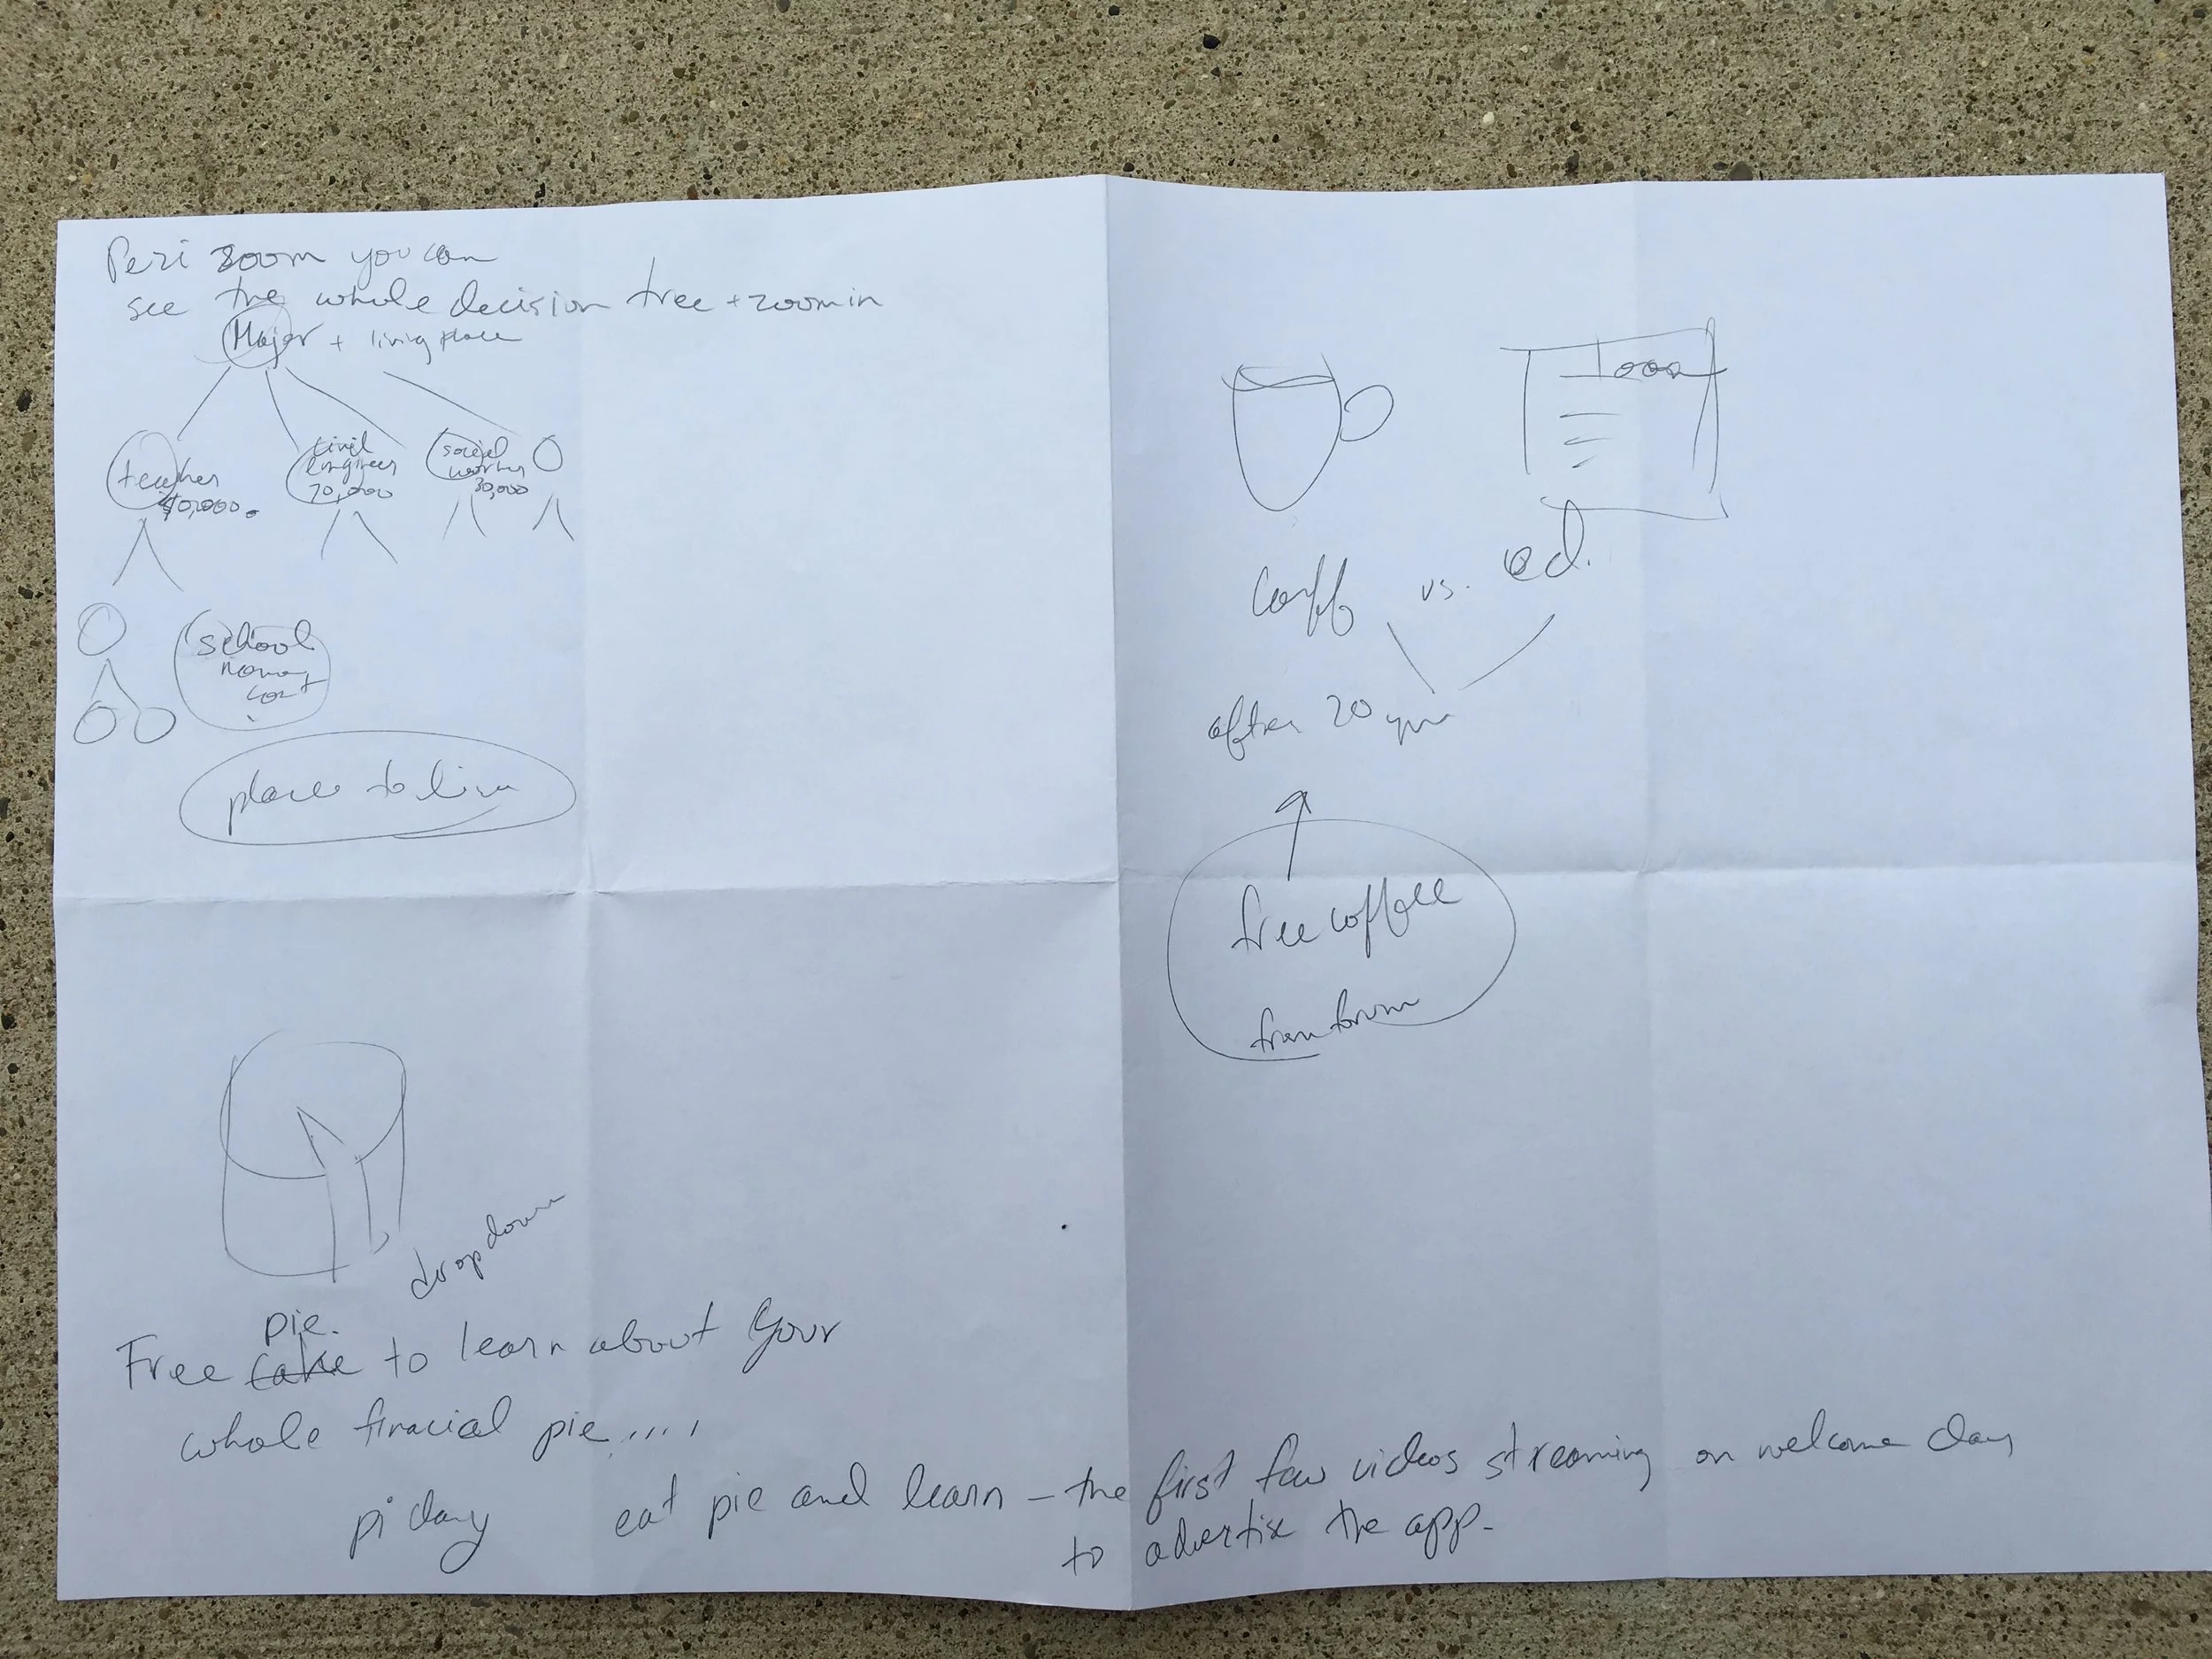
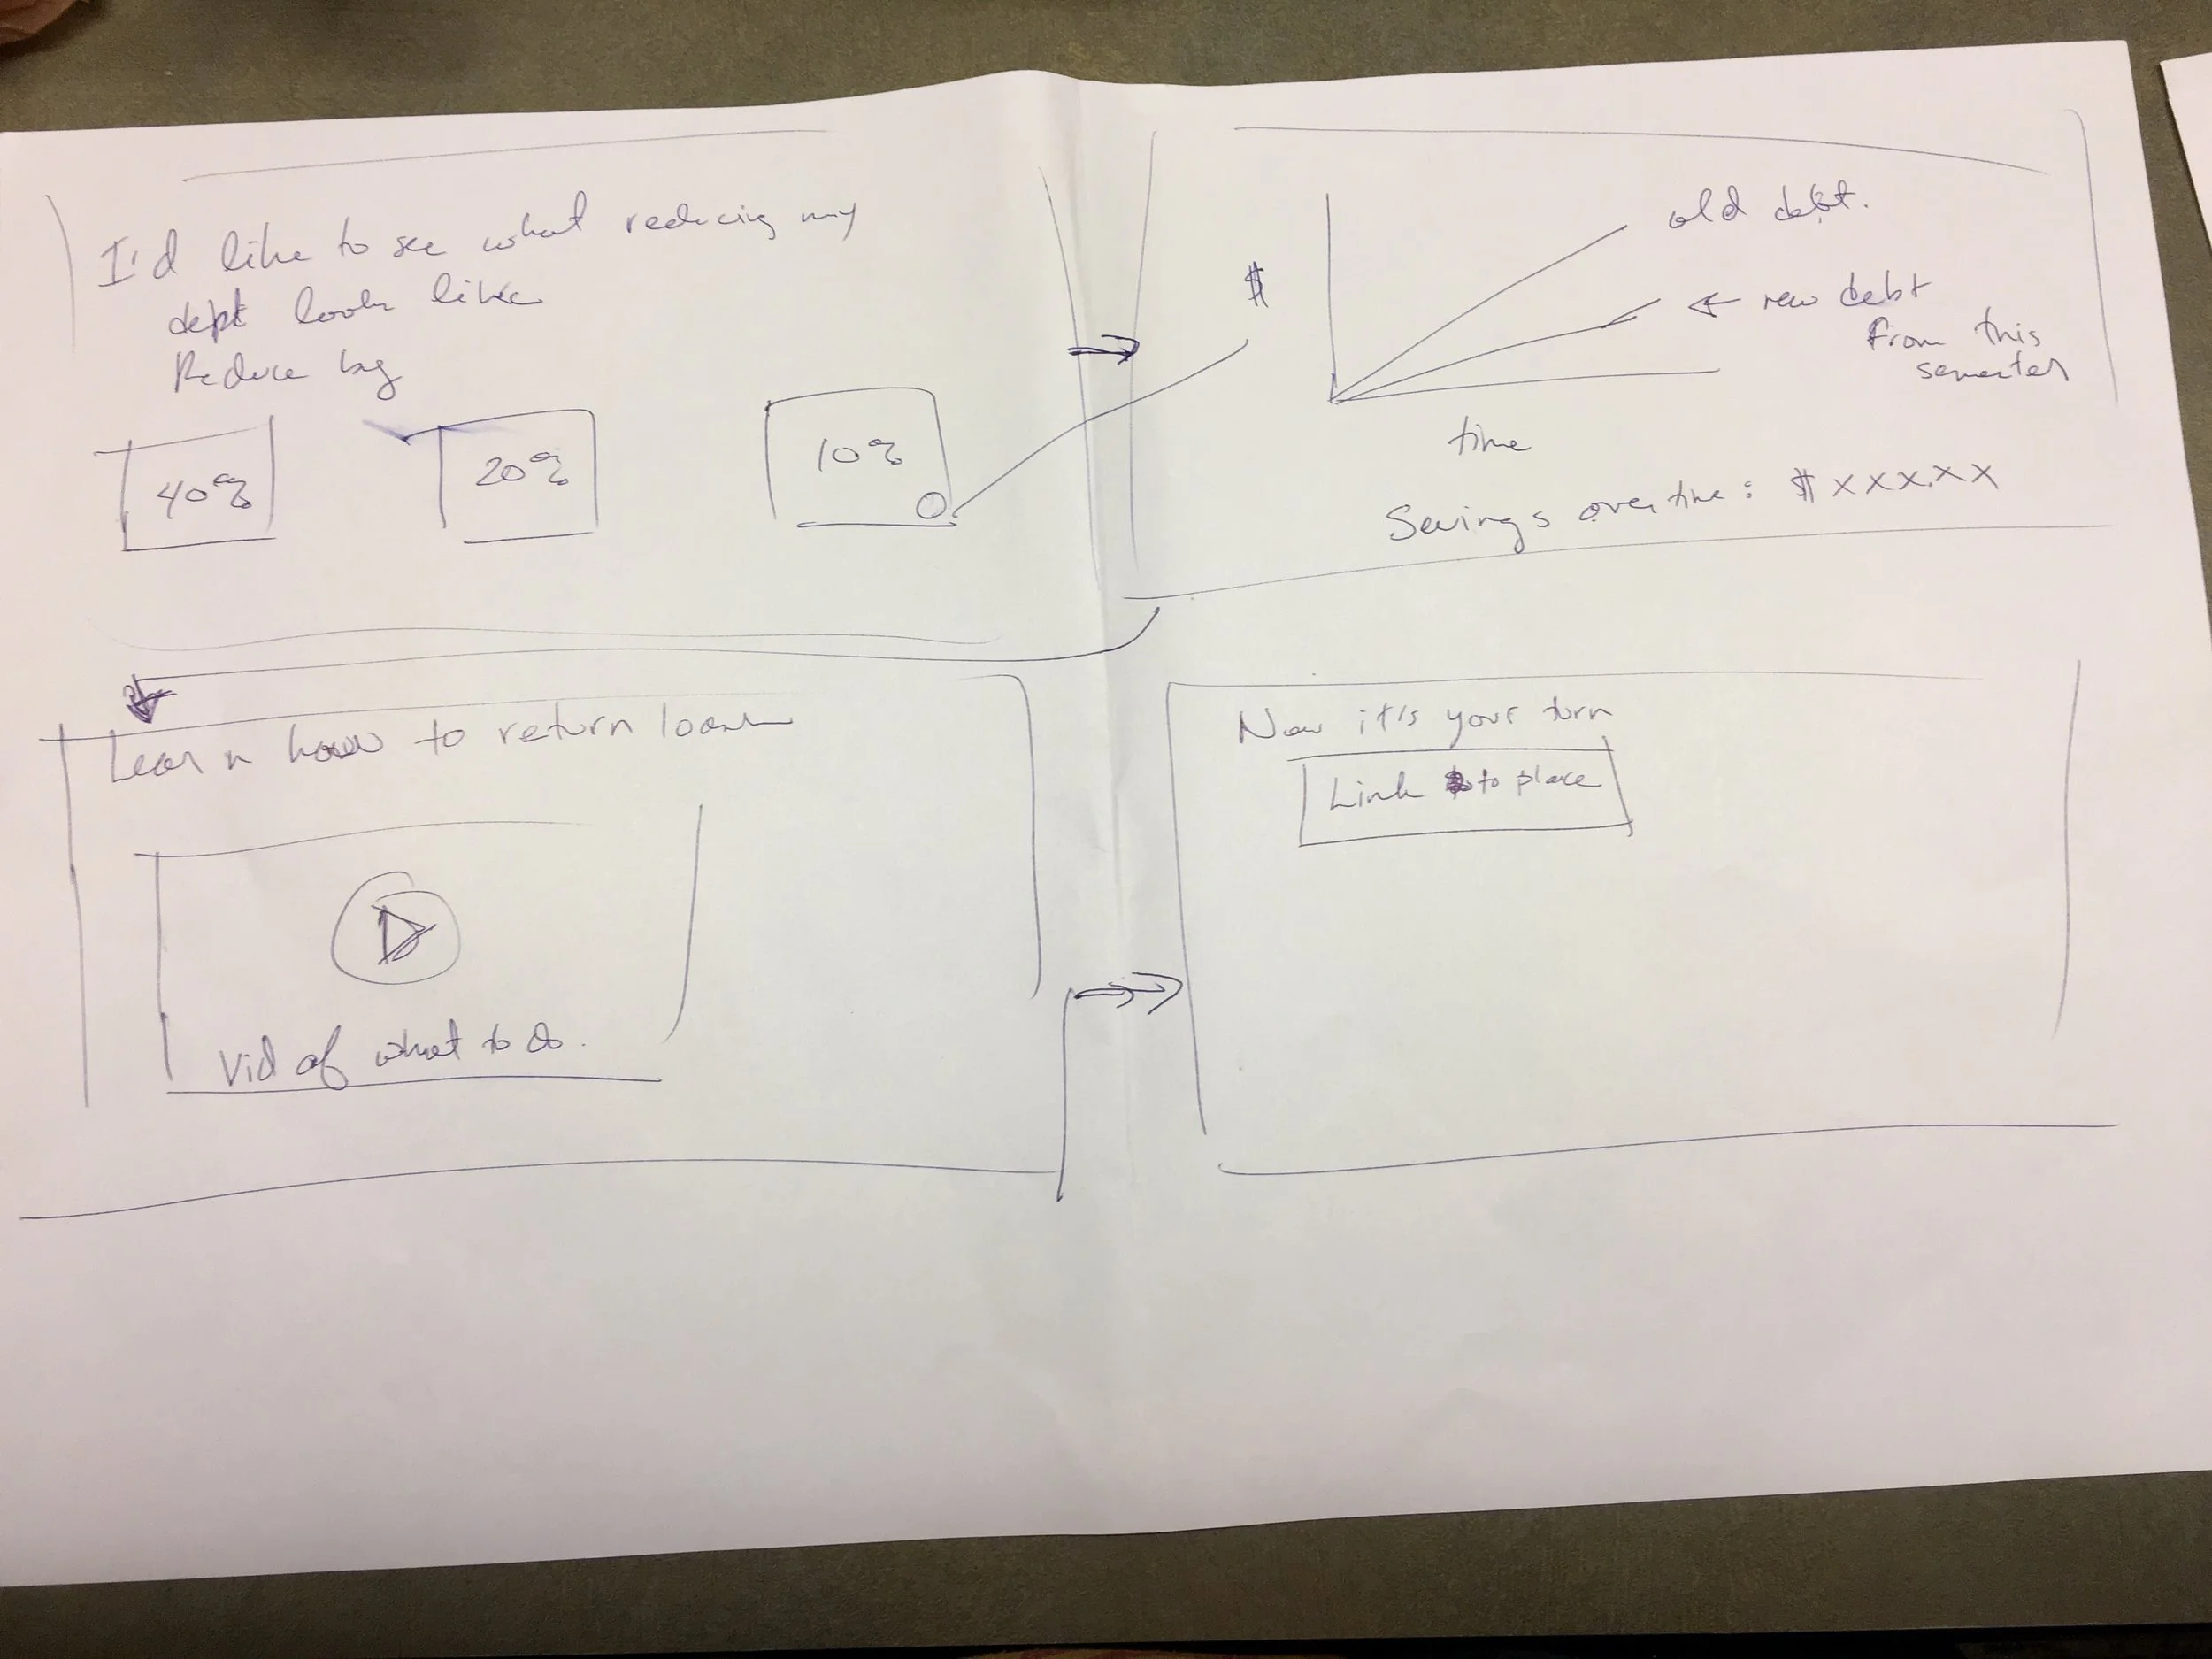
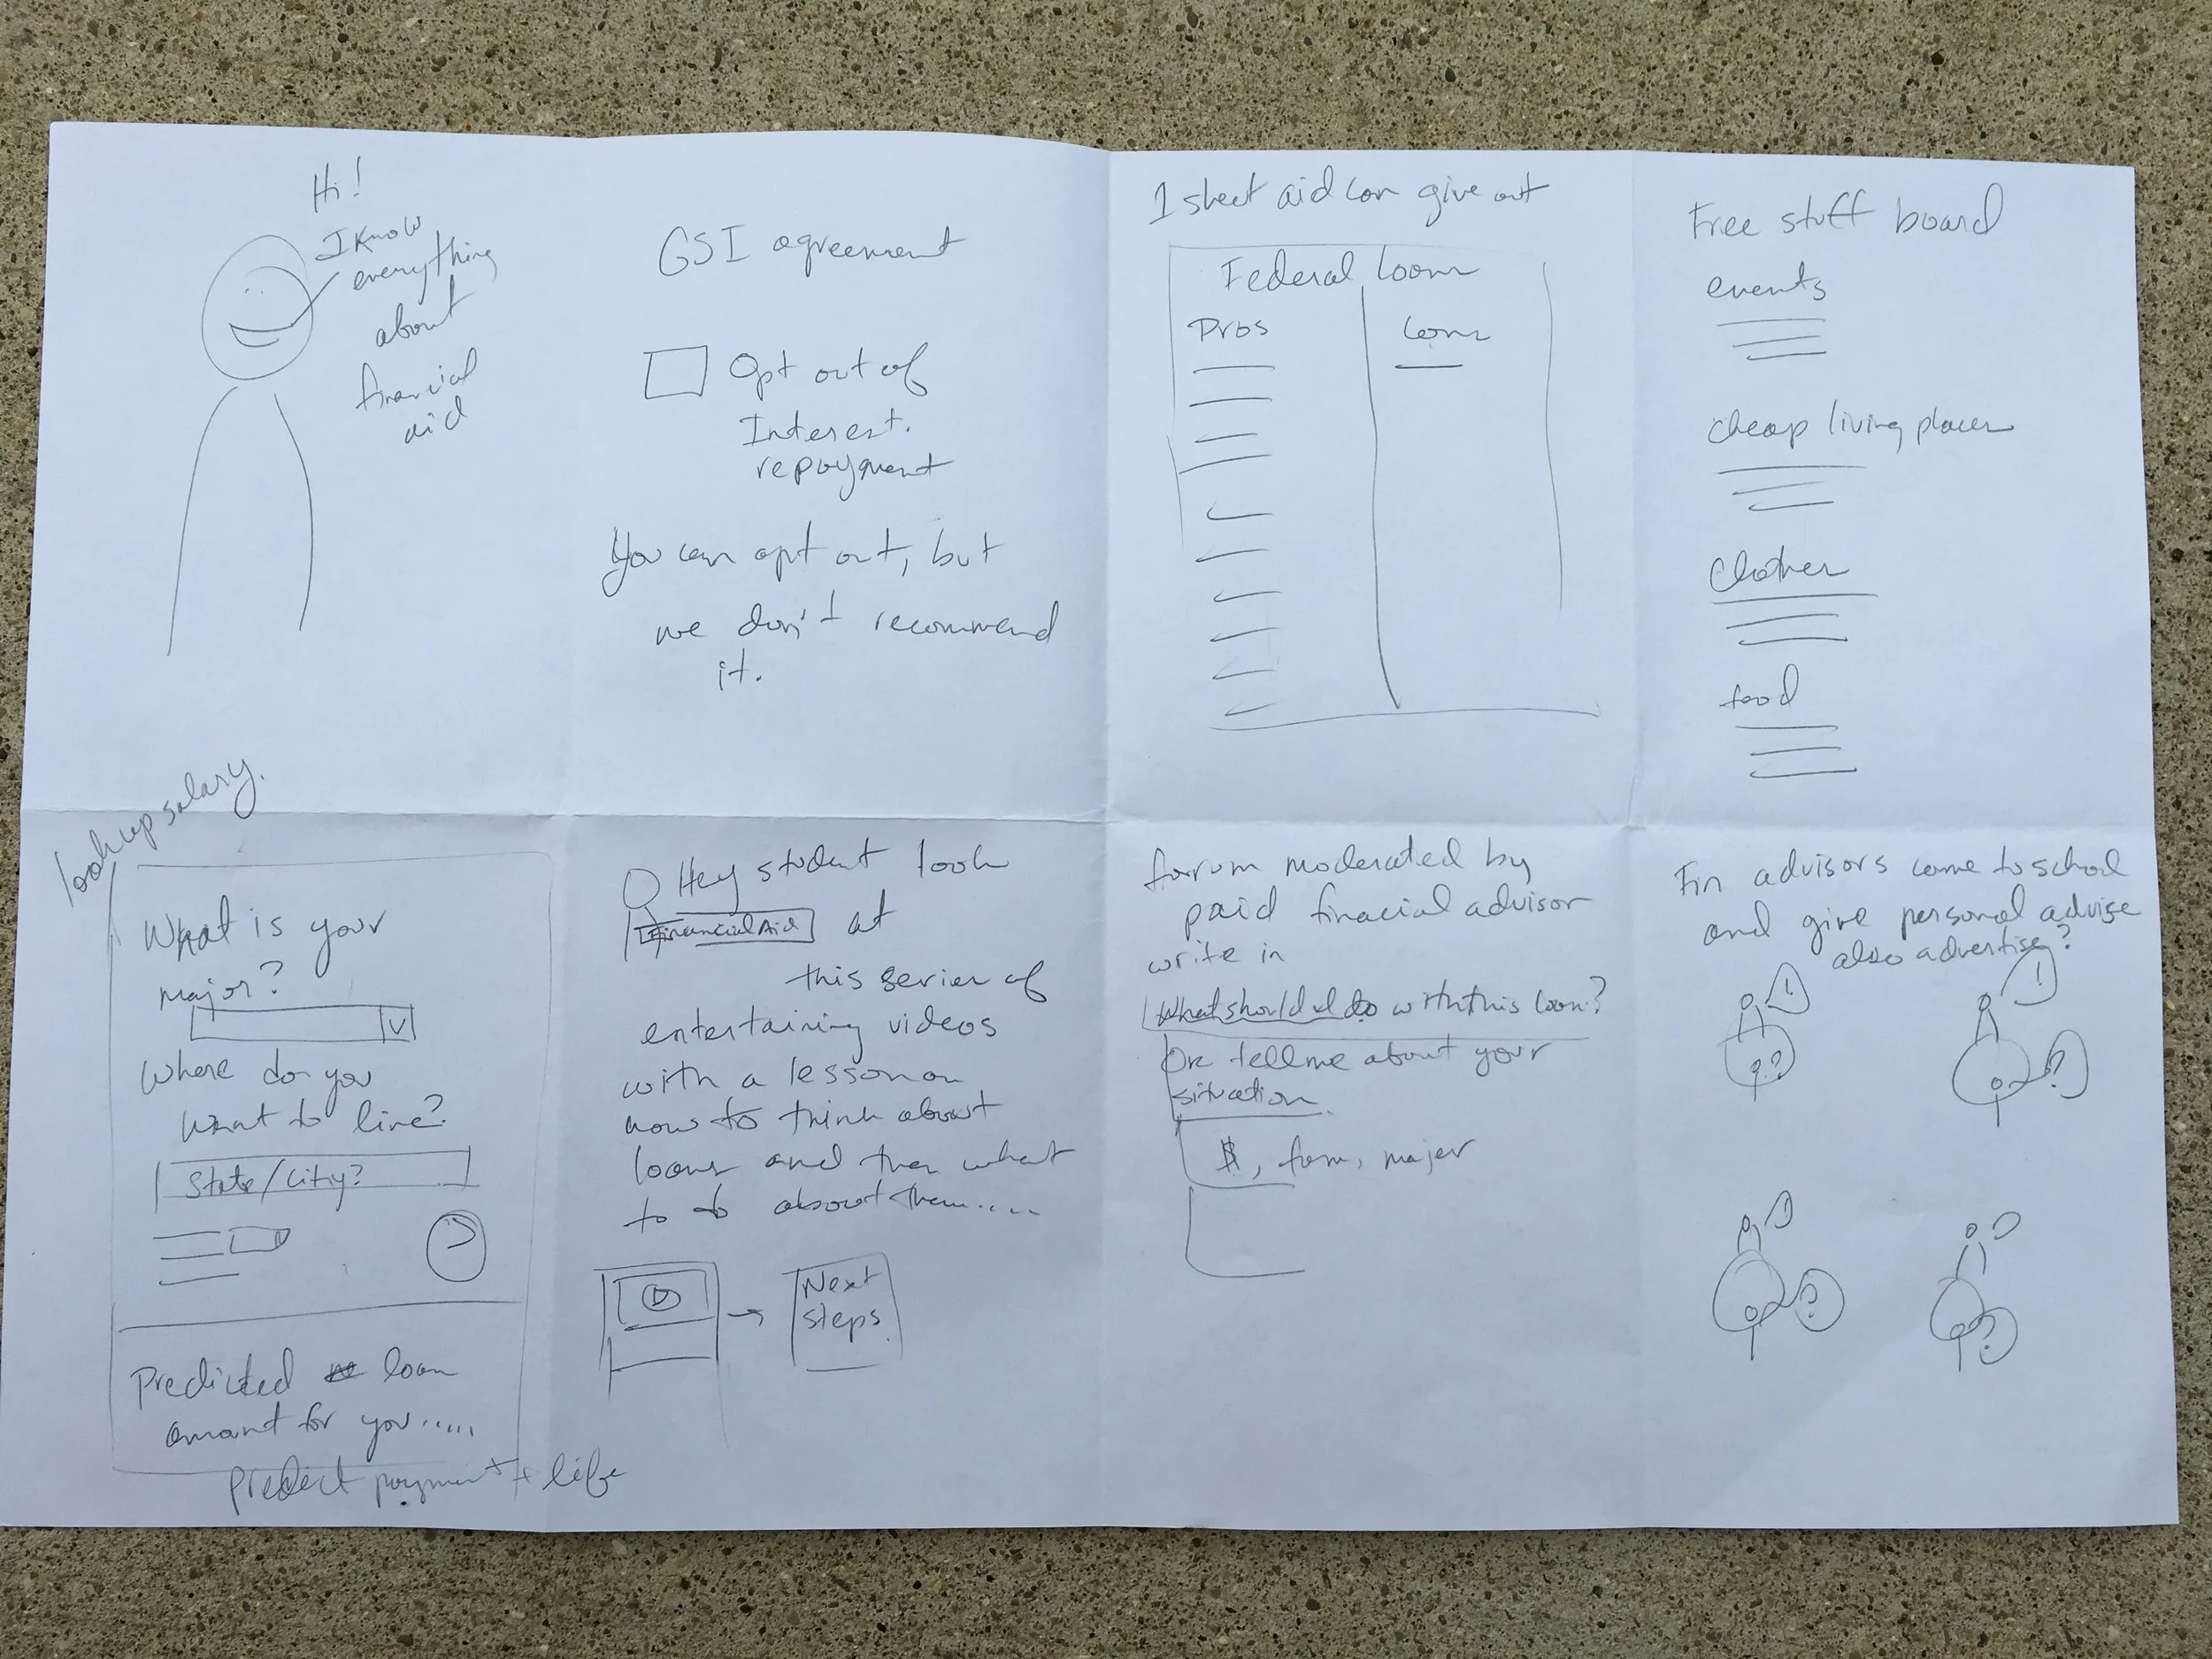
Our Lead Designer, Yui Phan and I came up with this initial design.
Research - Are we on the right track?
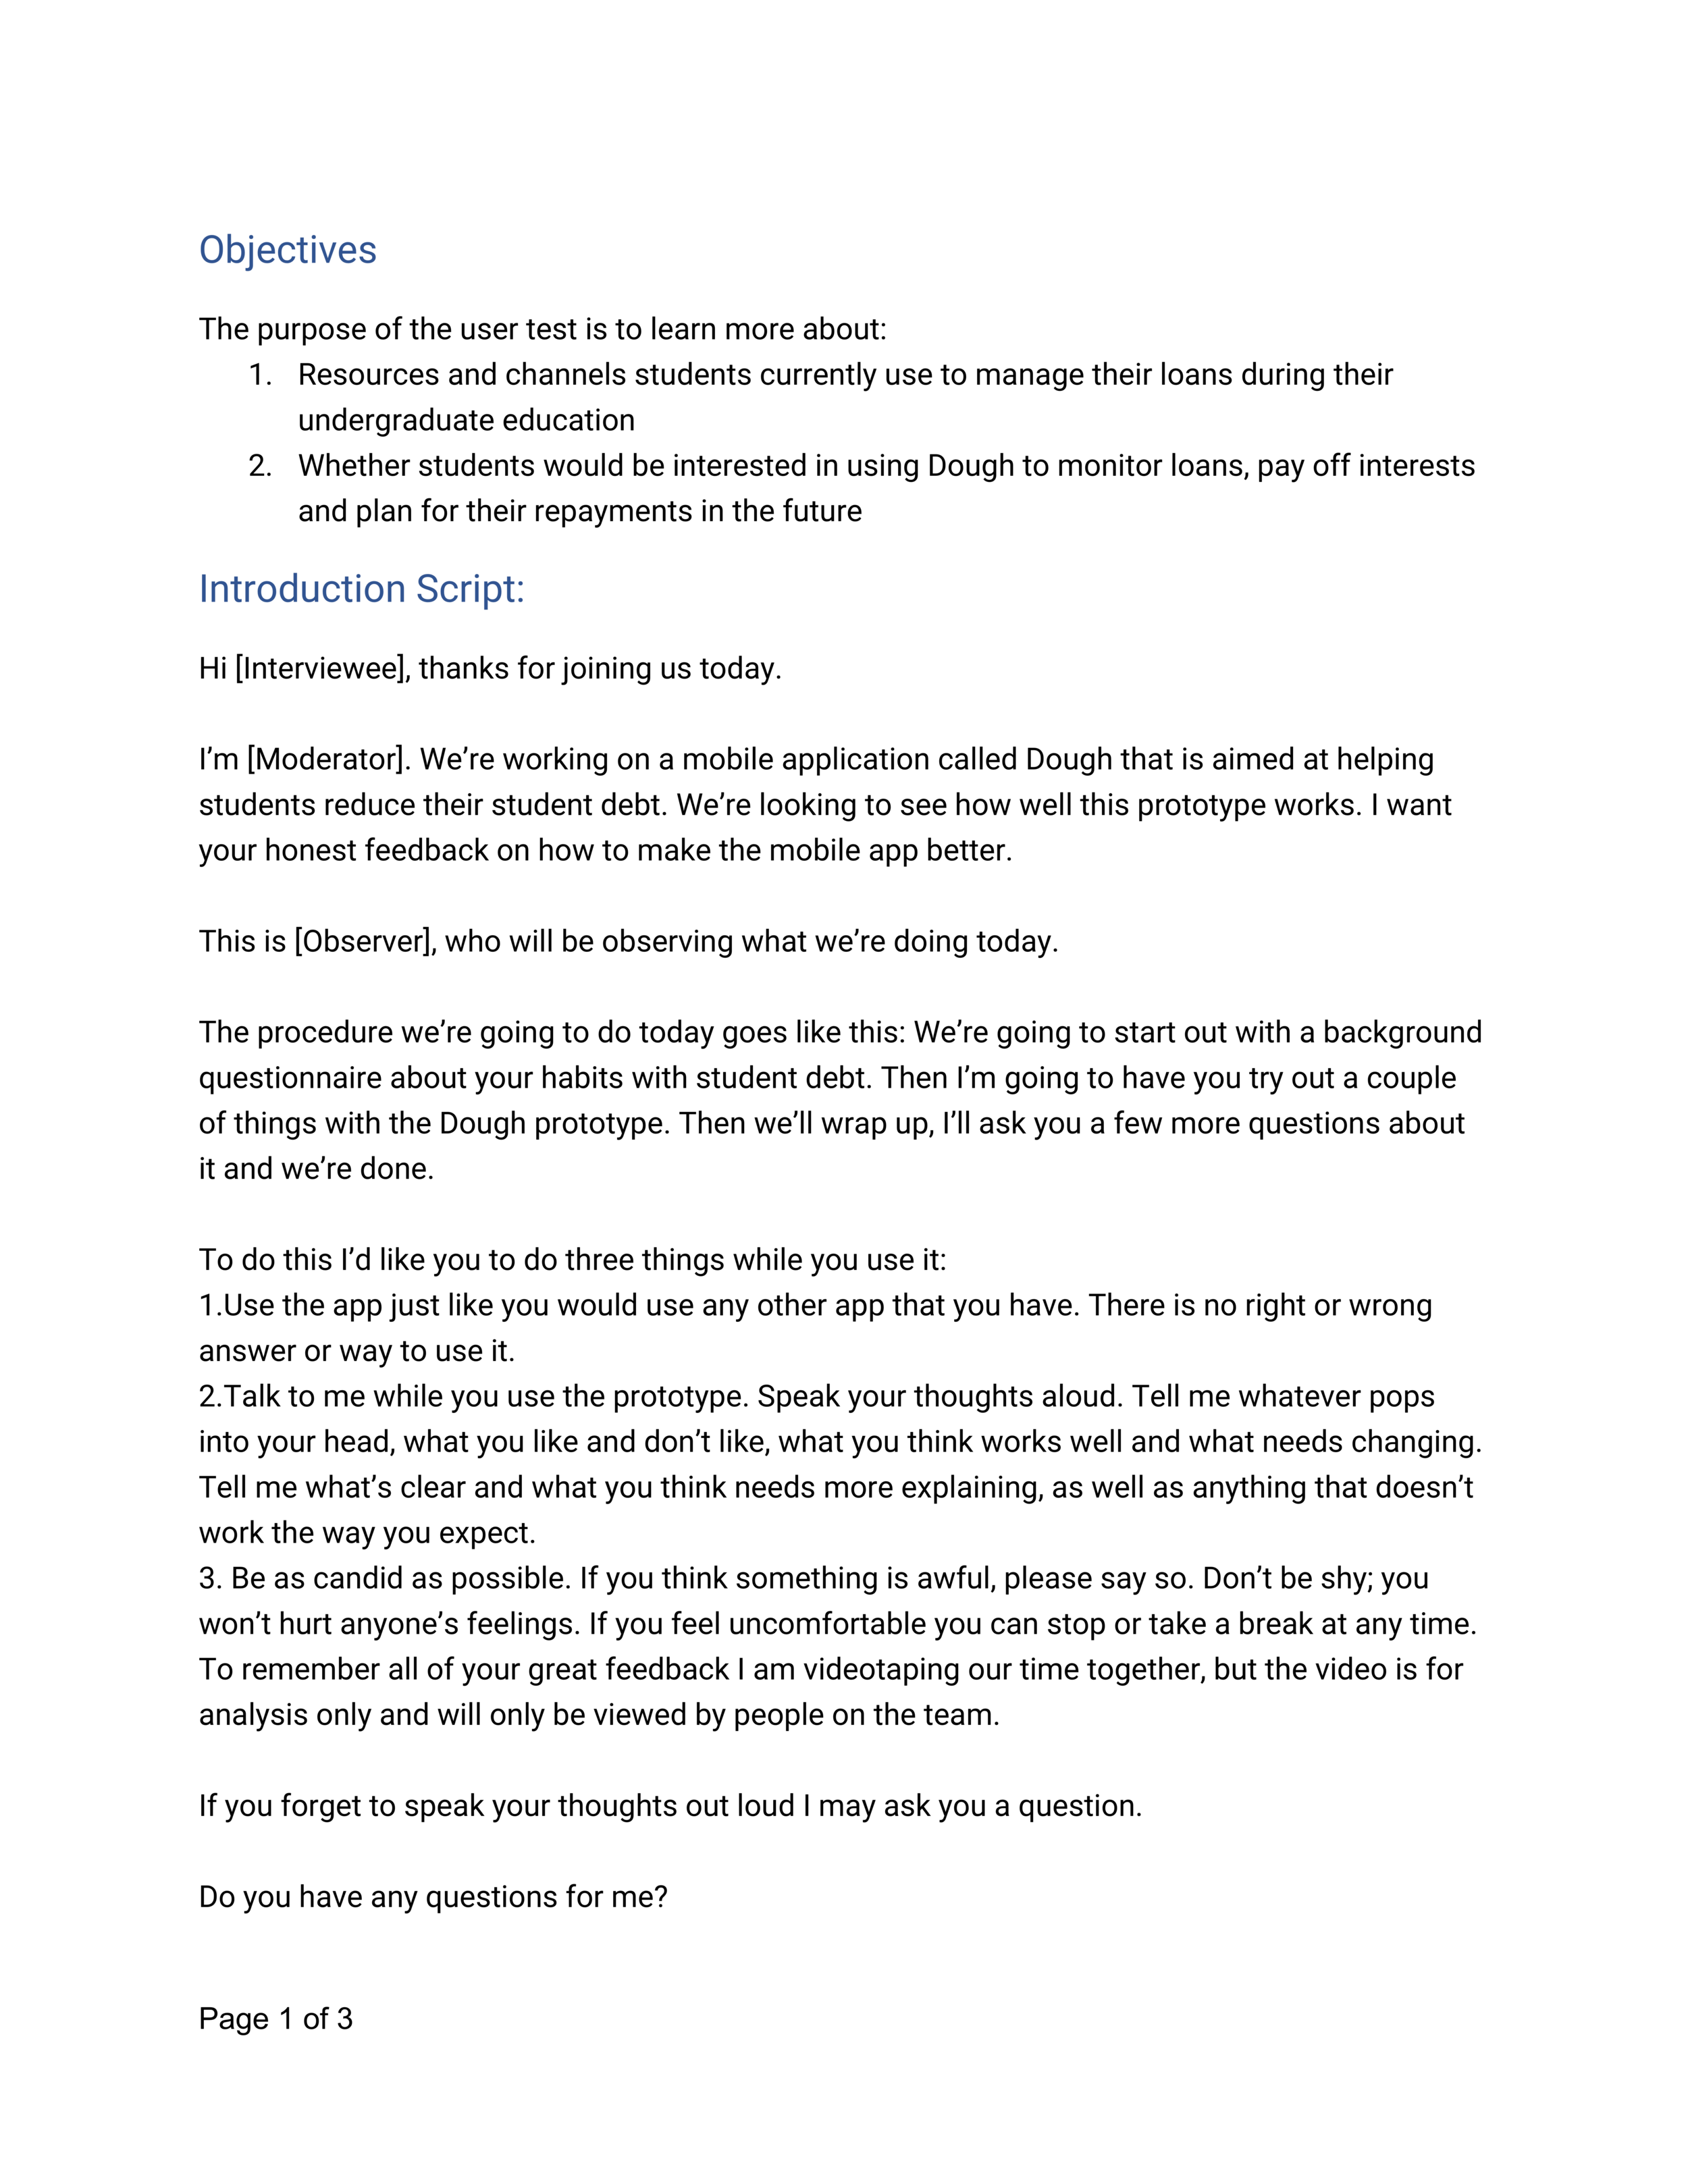
Determine whether students would be interested in using a personal loan assistant to help them manage their student loans.
Learn more about resources and channels students currently use to manage their loans during their undergraduate education.
Get feedback on initial designs.
Methods - Semi-structured Interviews & Moderated Product Testing
I used a Frankenstein-like combination of semi-structured interview questions and moderated product testing to answer our research questions.
I chose those methods because it provided quick insight into whether or not undergraduate students would be interested in using a personal loan assistant product as well as immediate feedback about our initial designs.
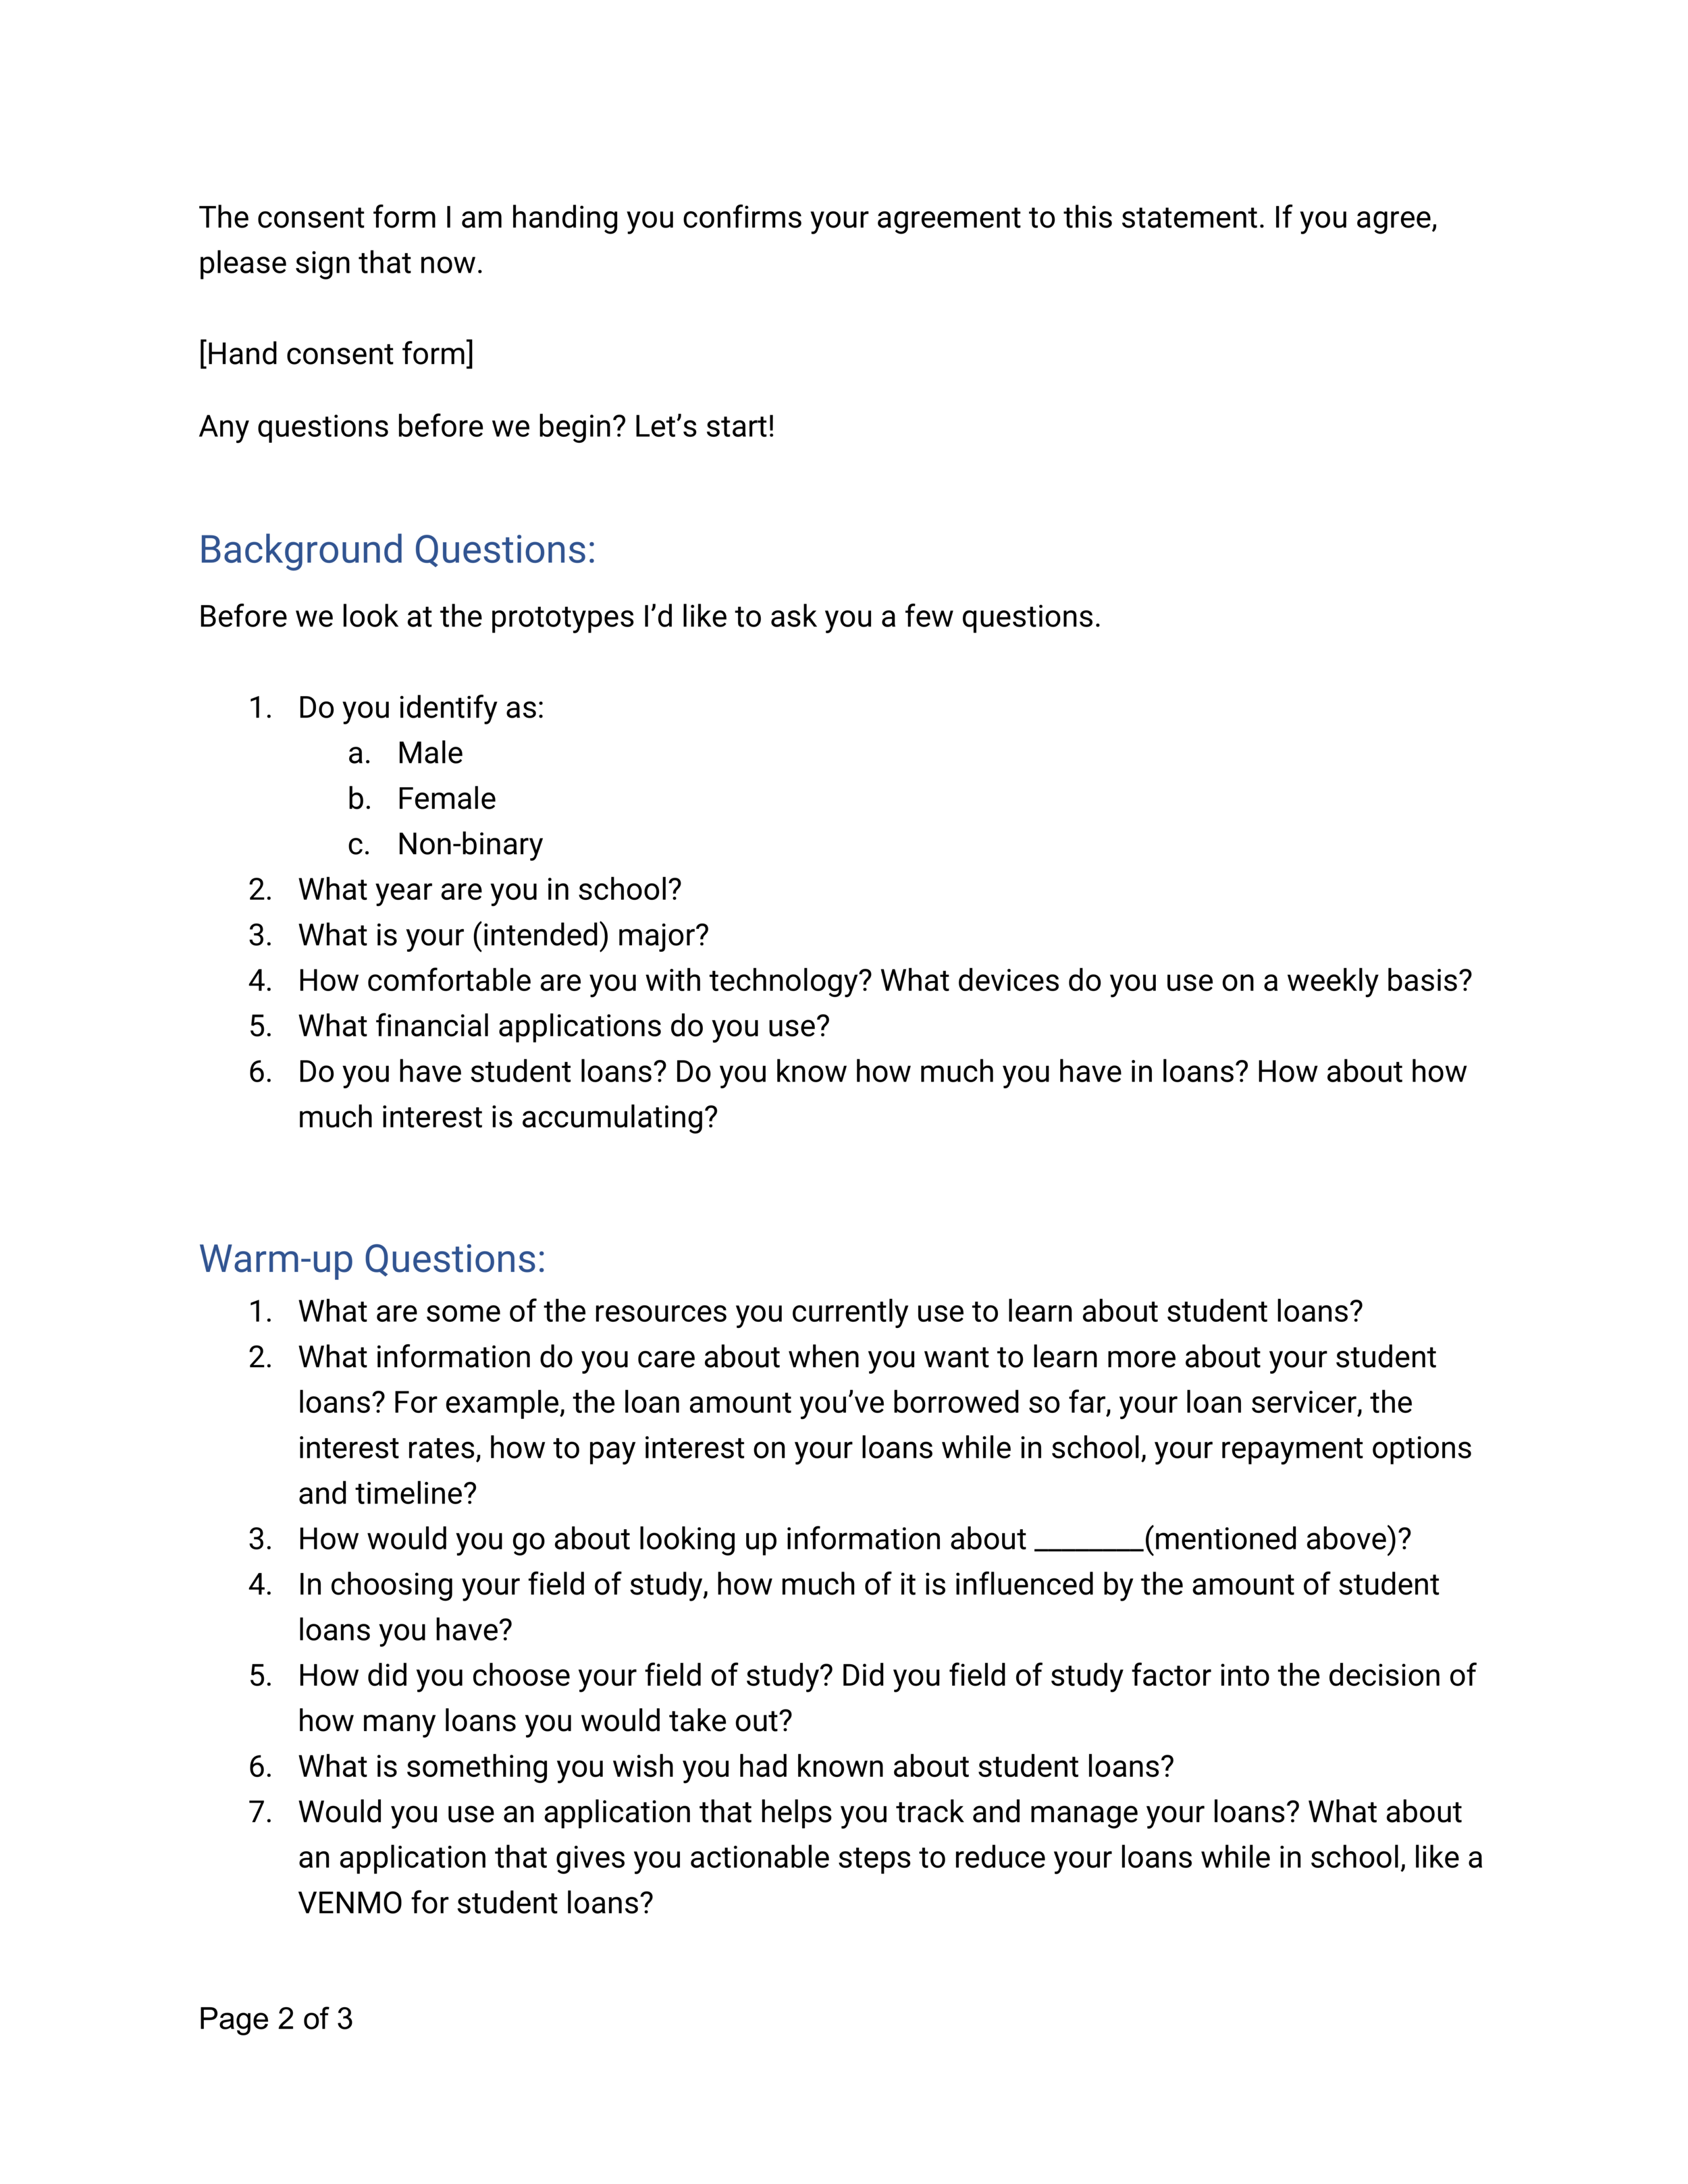
Participants - Wayne State Undergraduate Students with Debt
Our participants were Wayne State undergraduate students with student loan debt. We recruited Wayne State students because Dough had a partnership with Wayne State University for the first release of the product.
Recruitment Challenges - No Shows
We thought there would be five students lined up to be participants in our user testing at Tech Town in Detroit because of our CEO’s connections there. But 3 out of 5 the people who were supposed show up, didn’t show.
So, we recruited participants in Wayne State’s campus coffee shop by walking up to people and asking if they had student debt and if they had 45 minutes to talk to us in exchange for a $15 Starbucks gift card.
The five participants were university students, sophomores through seniors, with student loan debt, from a variety of majors. We recruited sophomores, juniors and seniors because they already have some experience with student loans.
Findings - Yes, we’re on the right track!
Finding 1: Students’ displayed an overwhelming demand for a personal student loan assistant product. All our participants were interested in staying in touch so that they could use our product when it goes into production.
“Please take down my email address, because I want to use this when it comes out.”
-Participant 1“When do you plan on launching the app? Will I be able to use it? Even if it’s after I graduate?”
-Participant 2“I feel like, a lot of universities, like, don’t tell you a whole lot. And with your parents, if you’re not, like, sitting there talking to them about it, all the way through, you still miss out on a lot of stuff. So I think this would help to fill in the gaps that you don’t get from a university or your parents”
-Participant 3
Finding 2: All five participants’ main source of information about their loans was their parents and other relatives with debt. Three of five participants also used their loan servicer’s website to learn about their loans.
Finding 3: Students think bar graphs are clearer than line graphs for showing how a loan grows over time. Students were confused by the line graph. They thought the bar graph was more concise because it showed them how much their total debt would change at important snapshots in time: now, at graduation and in 10 years.
Finding 4: All participants thought this subtraction problem clearly showed how much money they could return from their student loan:
total aid package- what you need = what you can return
Finding 5: The ROI of students’ education has no bearing on their decisions to take out loans.
“Freshman and sophomores want flexibility with their major. So the loans [they take out] aren’t part of that decision.”
- Participant 3“I’ll take the money out and figure out how to pay it back later”
-Participant 4
The Instrument
Personas
I created personas based on the semi-structured interviews and moderated product testing.
Dough - The Second Iteration
Based on the overwhelming demand for a personal loan assistant product, we continued researching and designing Dough.
Our second design iteration incorporated my research findings.
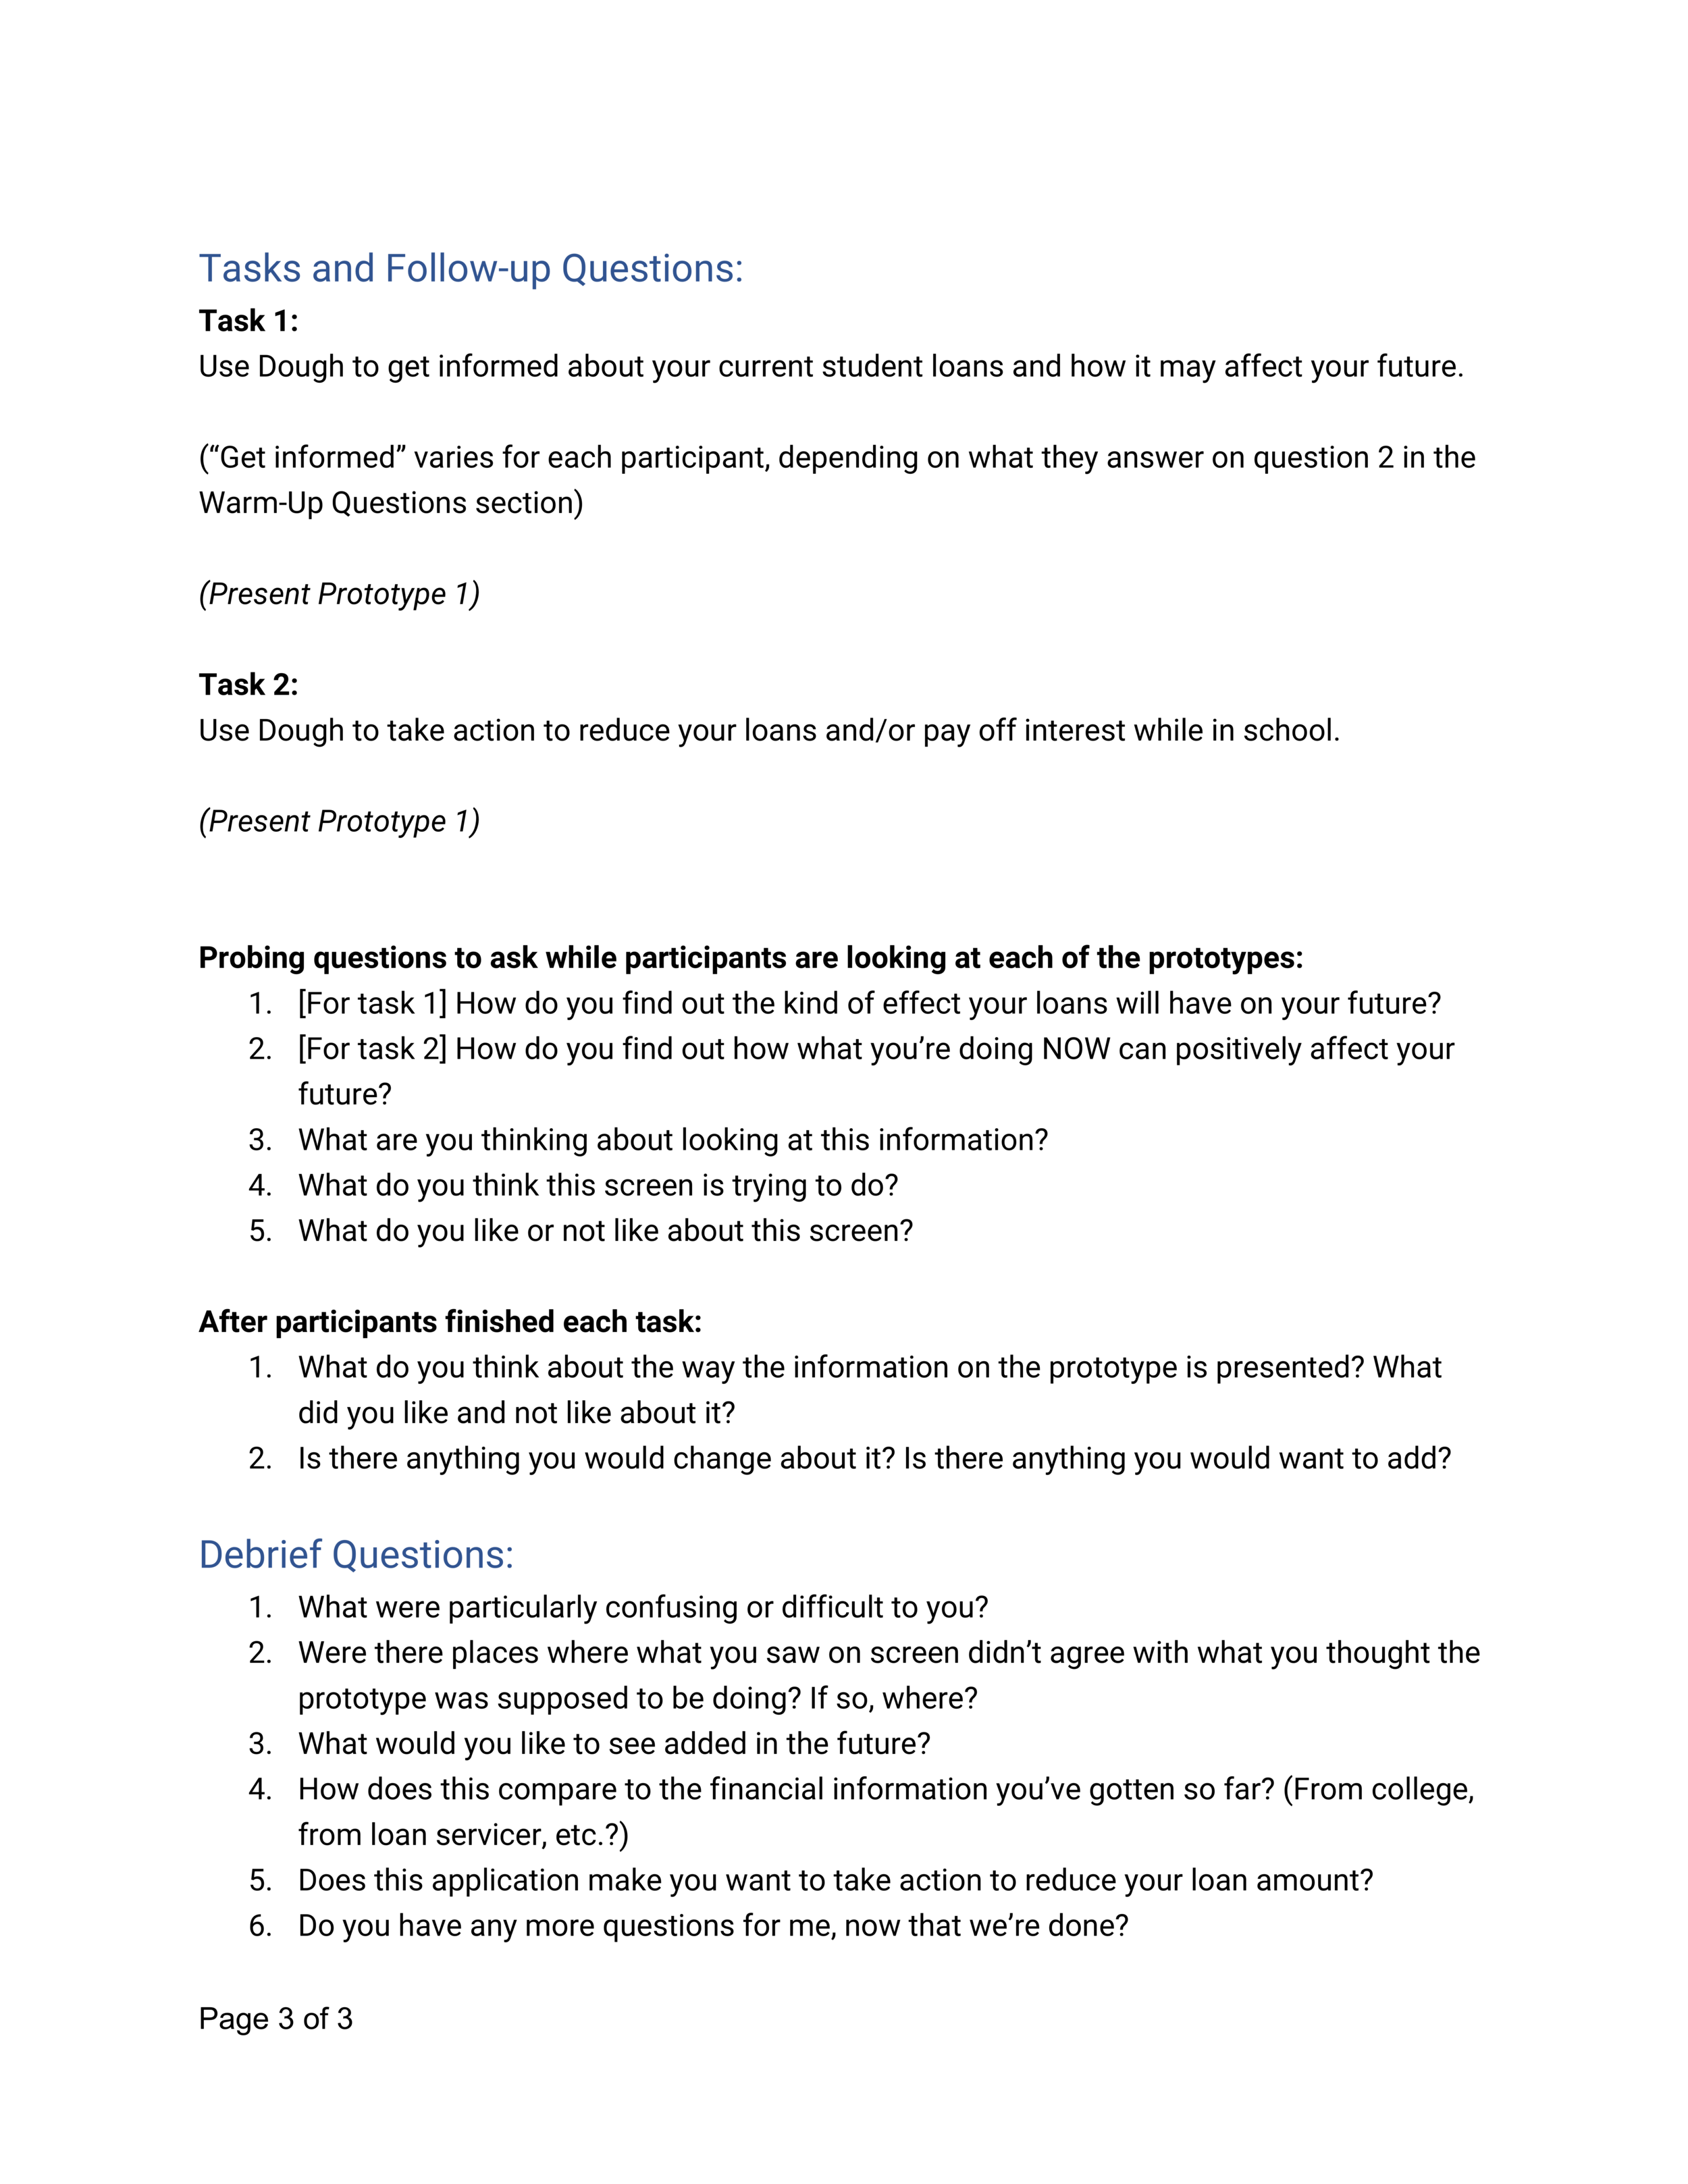
We included a calculator to help students calculate how much money they need each semester.
We included a subtraction problem that helps student figure out how much of their loans they can return.

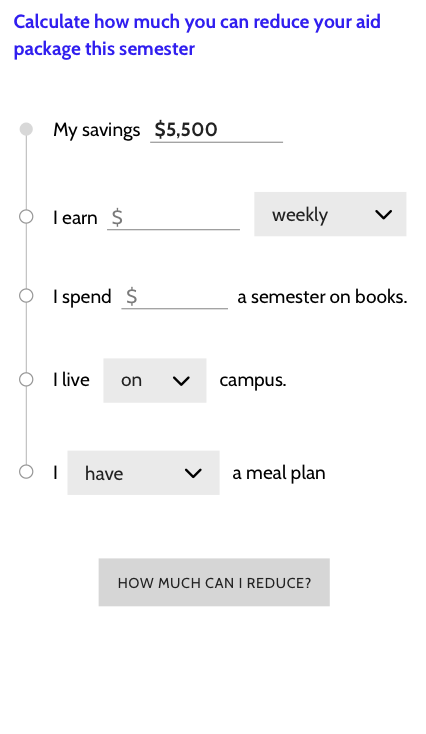
We designed more bar graphs that showed students’ debt over time in the “Overview”and “Take action” sections of the application.
Designs
Methods - Semi-structured Interviews & Moderated Product Testing
I decided to use the same method as before because we got fast, clear results and needed fast, clear results again.
Participants - UMich Undergraduate Students with Debt
This time we recruited undergraduate students with student debt from the University of Michigan. We did this because it was more convenient to test students in Ann Arbor than students in Detroit. Also, my research questions were about higher level concepts and the tests would likely yield similar results in both cities, so there was no need to drive an extra 2 hours to get to Detroit.
Recruitment - Hi, do you have student loans?
The CEO and I walked around a Starbucks right next to the University of Michigan. We asked if people had student debt and had some time free to look at our product in exchange for a $15.00 Starbucks gift card. Starbucks is a great place to recruit with Starbucks gift cards.
Findings - Visual Clarity and Motivations
Finding 1: Students’ continued to display an overwhelming demand for a personal student loan assistant product.
Finding 2: Most students don’t know that they can return a portion of their student loan within the first 30 days of the semester. If we are going to encourage students to borrow less money, then we need to tell them that it’s possible to return their loans within the first 30 days and give them instructions on how to do that. Students liked the idea of a calculator function that would help them figure out how much money they could return.
Finding 3: While bar graphs make the total amount of the loans clearer, slicing the bars into pieces, i.e. principle, interest, and loan fee, is confusing. The circle chart on the “Current debt” screen did a much better job conveying the breakdown of students loans. When they saw that circle chart many students were surprised that their loans included loan origination fees. I recommended abandoning the slices and using the circle chart.

Finding 4: Curved lines on the repayments graph are confusing. People didn’t understand this at all. I recommended taking it out of future designs.
Finding 5: A savings of $2,000 wasn’t enough motivation to change student spending habits. Students were shown the long-term benefits of paying off their loans’ interest early, $5.00 a week towards their loans’ interest could save them $2,000 over the life of their loans. Yet, students said they would rather keep buying a $5.00 cup of coffee each week than pay off the interest of their loans early.
“I’m still going to drink coffee.”
- Participant 1
“It’s not a big difference in my loan.”
- Participant 2
This is an on going project. Please email me at lauren.elbaum@gmail.com for information on the latest testing and designs.